Using the Chrome web developer tools, Part 4: The Timeline Tab
If you open the Chrome web developer tools via View > Developer > Developer Tools, you see 8 tabs: Elements, Network, Sources, Timeline, Profiles, Resources, Audits and Console. The ordering of these tabs suggests a "workflow" of sorts where you would use the Elements tab to get your document structure perfect, the Network tab to check your page load, and the Sources tab to verify your Javascript components. Once you have the page working, though, you'll probably want to focus on performance tuning, which is where the Timeline tab comes in.
Figure 1, below, illustrates the Timeline tab immediately after having loaded Example 1, a bare-bones page with a single <p> tag and nothing else - no Javascript, no CSS, no images. By default, the Chrome profiler view is not very interesting — or at least, it doesn't give you very much information about your page — because (as you'll see) timeline tracks very fine-grained information about your page's performance, you have to tell Chrome when to start and stop collecting it. To do so, click the circle icon in the upper-left corner, the "record" button.
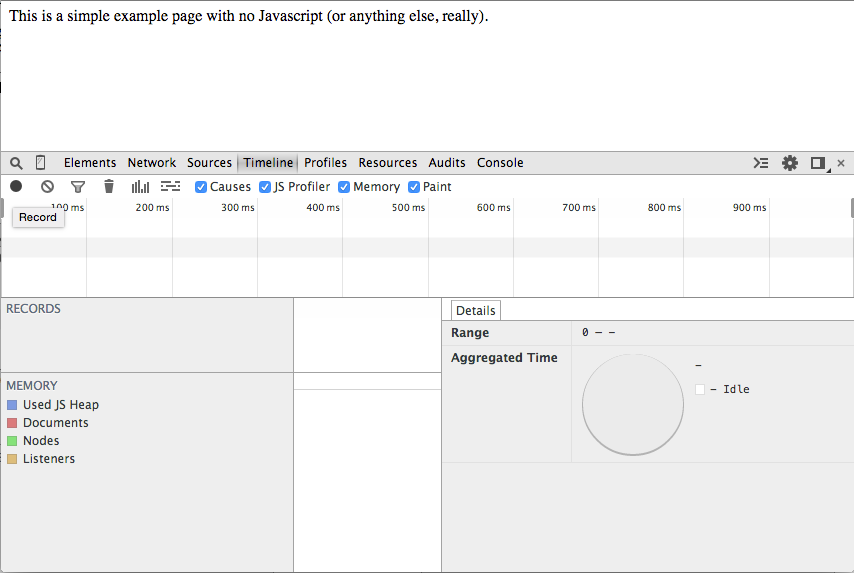
Figure 1: Timeline tab after loading a simple page
Figure 2 shows a captured recording. Reproducing this is a bit tricky, because the timeline recorder runs until you turn it off; click the record button, immediately reload the page (use a keyboard shortcut like CTRL+R), and click it off quickly. As you can see, there's a lot of data produced in that subsecond response.
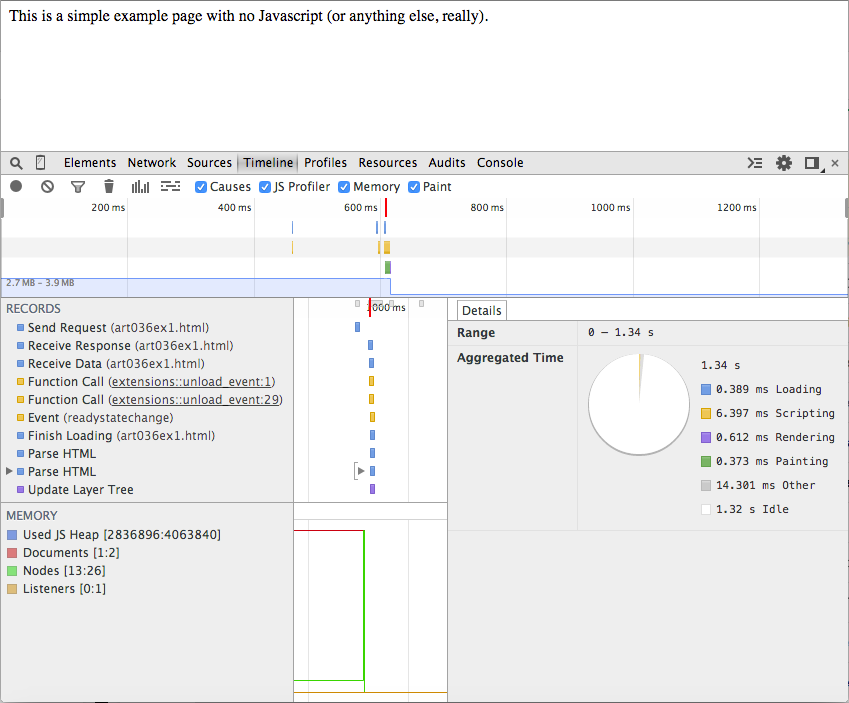
Figure 2: Timeline tab showing the load events
To reduce clutter, focus on the interesting part, and acquaint yourself a bit more with the
timeline interface, first uncheck the "Memory" checkbox along the top; I'll
come back to that view later on. Then, drag your mouse over the timeline
summary along the top, highlighting just the area with most of the colored
boxes, as shown in figure 3. This action focuses the detail view at the
bottom. Notice that I've omitted the two events to the far left. These
are the "Send Request" event that you see at the top of figure 2.
the browser sends the first GET request and doesn't get a
response for about 150ms — not enough time to matter when you're loading
at a page, but quite a bit of blank space when you're looking at the events
that happened in 3/4 of a second.
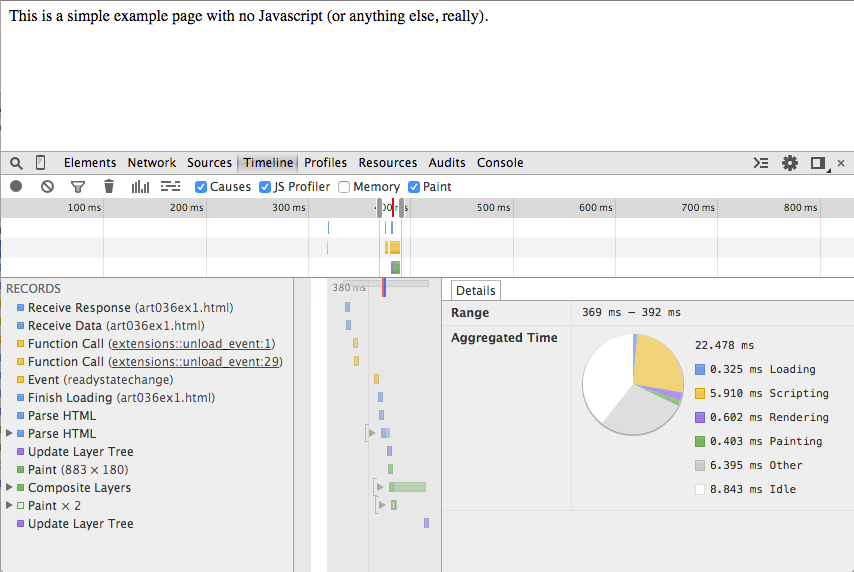
Figure 3: Timeline tab focused on the activities
Now you see that the browser did quite a bit of internal work in the roughly 23ms after the response was received. Chrome breaks the individual events into high-level color-coded categories: loading in blue, scripting in yellow, rendering in purple and painting in green. Loading refers to network interaction — loading and parsing HTML, CSS and Javascript. Scripting refers to Javascript events and event handlers. Rendering and painting have to do with the translation of HTML elements to displayable on-screen elements — primarily the processing of the CSS "box model". This explains the three lines in the summary view at the top; loading events is the first bar, scripting events the second, and rendering/painting (which are obviously intertwined) in the third. Here you can see exactly how long Chrome spent performing each individual task. The pie chart on the right also breaks down the relative time spent on each type of task as well as the idle time within the timeframe you selected.
If you click the "record" button again and move your mouse around in the window, you'll see (after turning the recording off) a sequence of scripting events like the display shown in figure 4. Since Chrome did work firing off the events — even though your page didn't intercept them — they're listed in the timeline view.
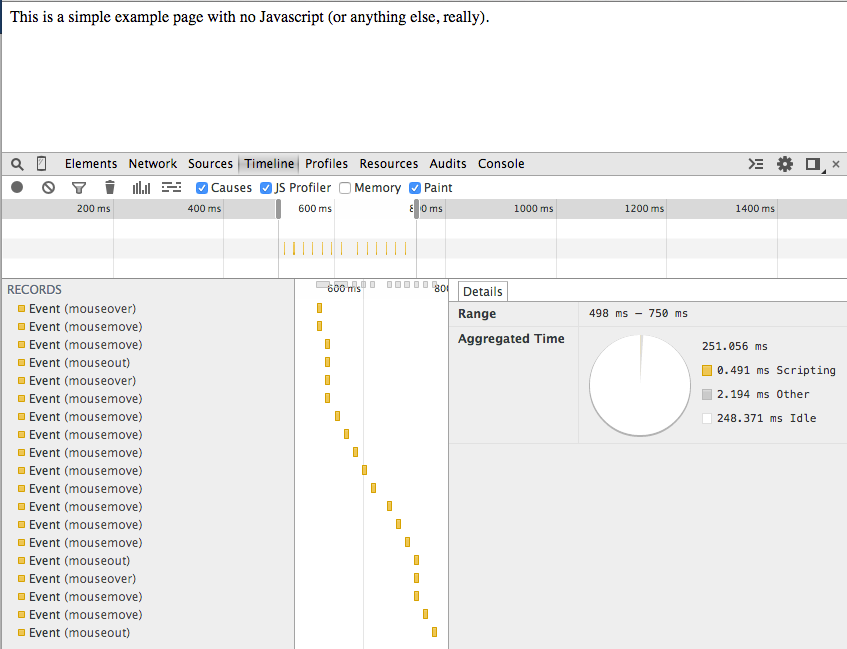
Figure 4: Mouse move events
For efficiencies' sake, Chrome tries to go ahead and batch up events. Notice along the top of the detail view, there are a series of light-grey bars; each of these represents a batch of activities. If you hover over one, you can see how much time the batch took and how many events were processed within it as shown in figure 5.
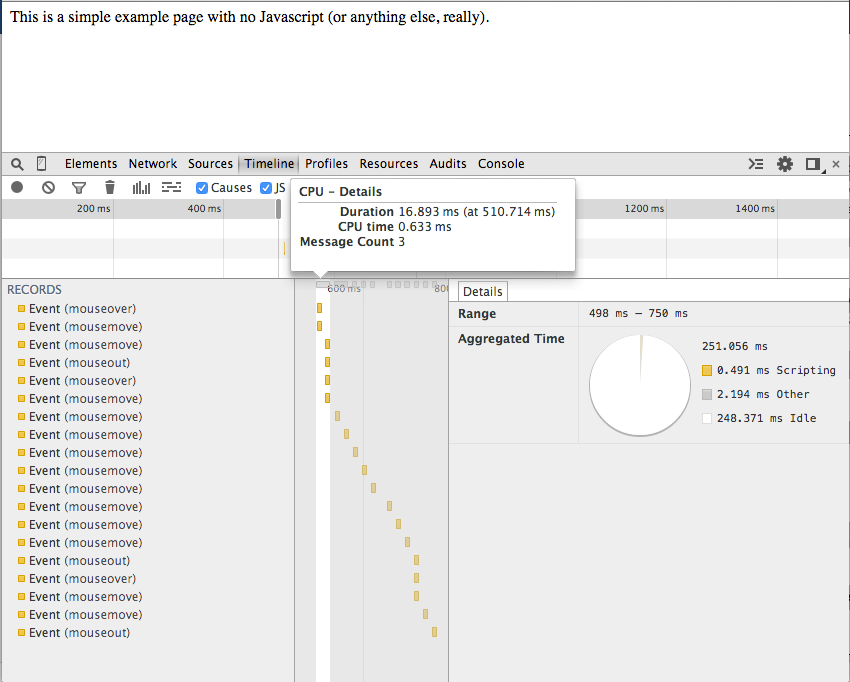
Figure 5: Batching of events
This is a pretty boring page, though. Take a look at the (marginally) more interesting page in Example 2. Here the page includes a blue box that you can click and drag around with your mouse. If you run the timeline recorder and move the box around a little bit, you'll see a more interesting display like the one shown in figure 6, below.
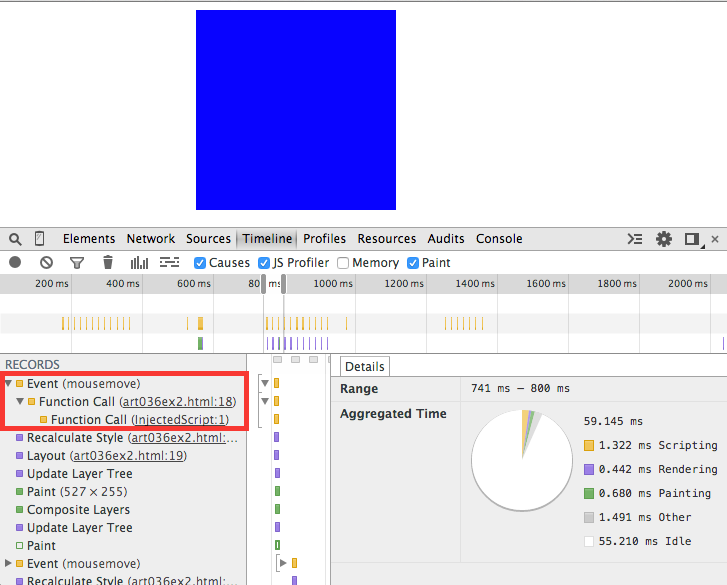
Figure 6: Scripting, rendering and painting
Here I've zoomed in on the "action"; whenever the browser triggers a
mousemove (after the mouse has been captured via a mousedown),
the timeline records the time spent processing the Javascript at the top. It
also shows you a tree view showing how the Javascript function was invoked.
After the Javascript function terminates, since it modified the DOM by
changing the top and left properties of the moveable
div, Chrome goes through a recalculate/update/paint loop to
change the display. Interestingly, if you click one of the paint
events, a new tab appears as shown in figure 7: Paint Profiler. If you're
familiar with the HTML5 canvas, this code should look somewhat familiar —
Chrome has an internal canvas-like interface that it uses to render objects
on screen; you can see all of the details of what it did to render the blue
square. If you hover over each line of the paint profiler, it will highlight
what, on the page, it painted using that line.
Depending on your computer, though, capturing this much detail may a) not be
needed and b) slow down the capturing process, so Chrome allows you to disable
the capture of the individual paint events and the invalidation causes using
the causes and paint checkboxes next to the
memory checkbox.
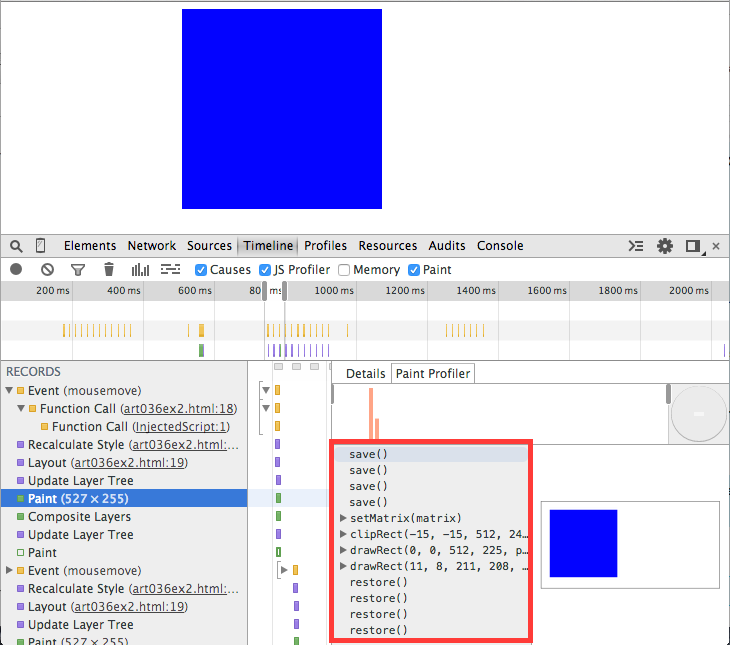
Figure 7: Paint Profiler tab
If you click on the Recalculate Style event as shown in figure 8,
Chrome will additionally tell you exactly where in your source code the HTML
was "invalidated" (meaning that it needed to be redrawn); if you see a lot of
paint events that you can't seem to track down, this will take you right to
the culprit.
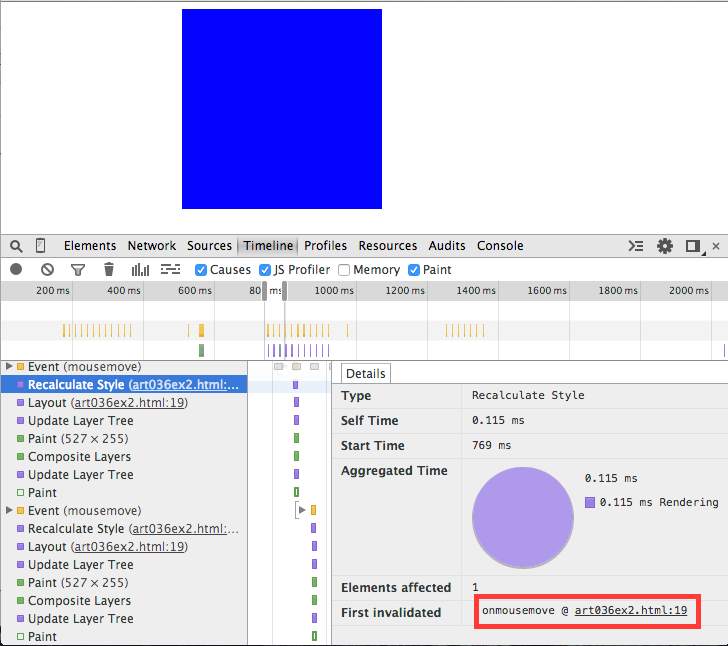
Figure 8: Recalculate Style
Another handy view on pages like this one that do a lot of dynamic "animation" is the frames view illustrated in figure 9. If you want your users to perceive a smooth animation, you should shoot for 60 frames per second — anything less than that will appear "jerky" to the user. This view breaks down your update/repaint events to illustrate how long each took.
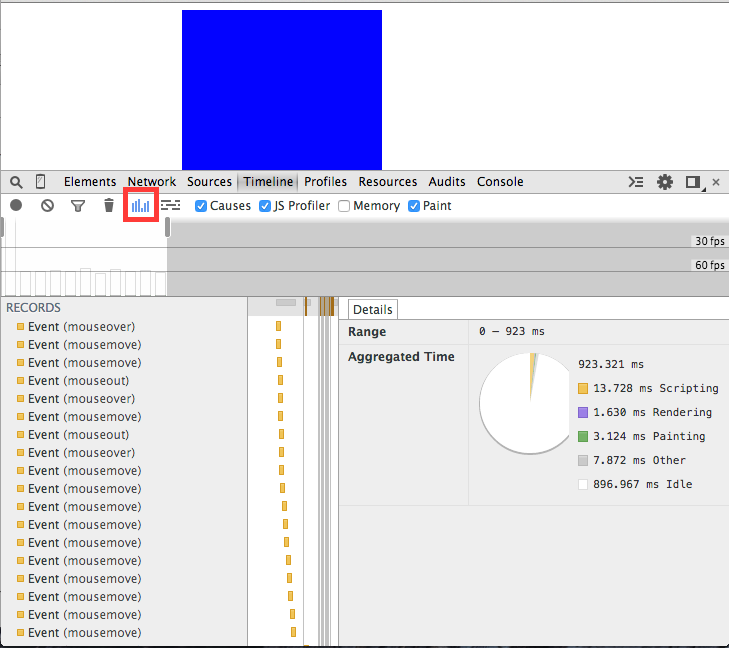
Figure 9: Frames-per-second view
Earlier, I unchecked the memory checkbox to avoid cluttering up
the display. I've re-checked it in figure 10. Note that unchecking the
checkbox doesn't cause the memory events not to be kept track of, it just
removes them from the display. Unchecking the paint checkbox,
on the other hand, causes the profiler to not capture them at all —
if you want to see the individual paint events, you'll have to recheck the
checkbox and run another recording.
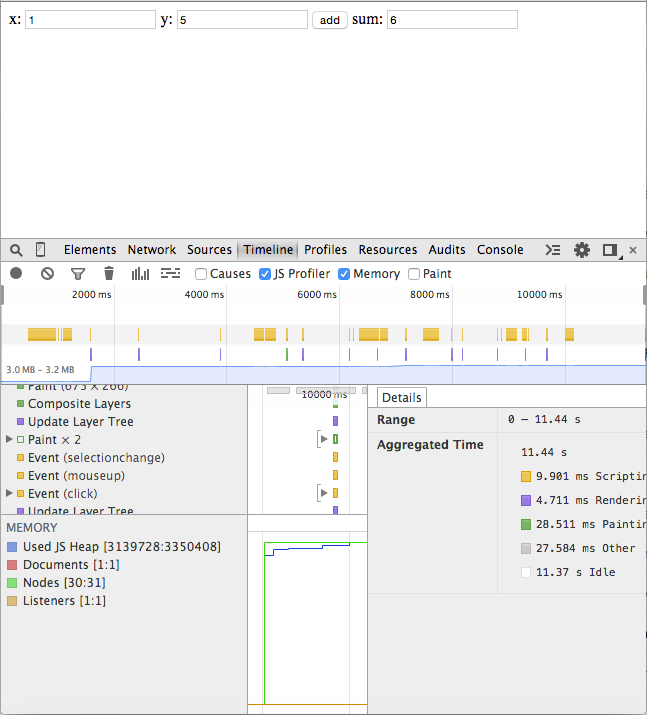
Figure 10: Memory view
The memory view keeps track of four individual sorts of memory allocations: Listeners, Nodes, Documents and "Used JS Heap". The first three are pretty self-explanatory — here, there's only one document (which won't necessarily be the case when you're dealing with multiple windows and iFrames), one to three listeners (one mousedown listener active at all times and the mousemove/mouseup handler active during a drag operation), and
Thus far, I've been suppressing the memory tab to declutter the
display. However, realistically, you probably want to keep track of your
memory usage as well. If you load Example 3, you'll
see a contrived memory leak — every time you input two numbers and click
add, the sum is stored in a globally scoped array.
Figure 10: Memory view
In figure 10, I've re-enabled the memory view and added a couple of numbers using example 3. Notice that the "used JS Heap" is growing. Now, all I can tell from the view is that it's growing — I can see on the timeline when it happened, but there are so many events in the events view that it's hard to see what the cause was. Chrome's timeline view has a robust filtering mechanism that allows you to zero in on what was causing the problem.
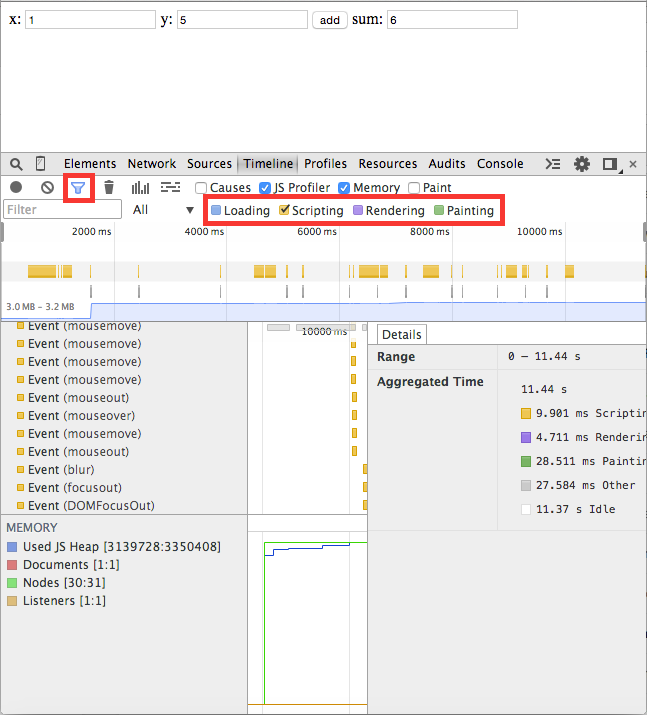
Figure 11: Filtering out non-scripting events
Since it's the JS heap that's growing, I assume that the culprit must be my Javascript code, so I start by opening the filter button and filtering out everything except scripting events as shown in figure 11. Still, that's a lot of events to sift through — that's just the nature of the fine- grained information that Chrome provides in the timeline view. I can filter even more by filling in the search box as shown in figure 12 — here I've narrowed it down to function calls only.
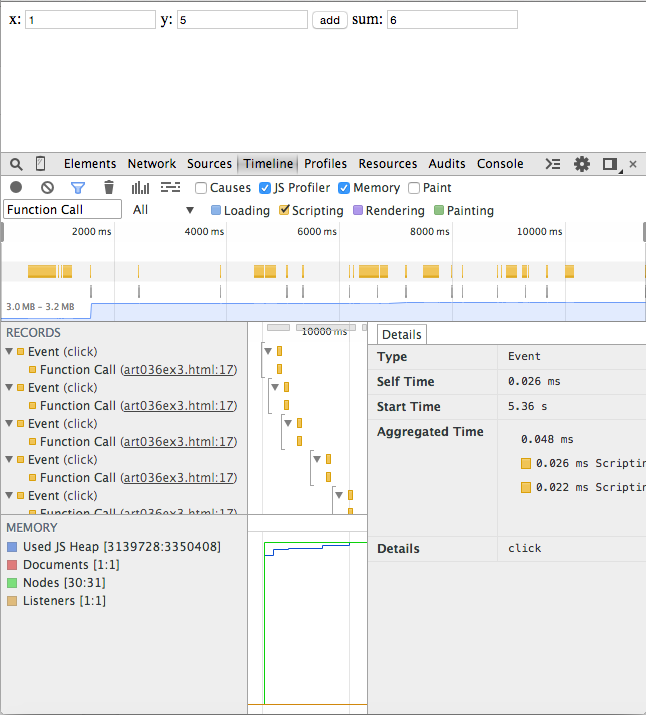
Figure 12: Filtering out everything except function calls
Here I can see that my JS heap size increases roughly every time line 17 is
invoked — which I can click through and see is my add call.
Although the timeline view was sufficient to track down the source of this
very simple memory leak, most realistic page leaks are much more complex —
too complex for the timeline view to help you with. Normally you use the
timeline view to confirm that you have a memory leak, but you use the
profiler to actually track it down. I'll cover the profiler in
the next installment of this series, so stay tuned!
Add a comment:
Completely off-topic or spam comments will be removed at the discretion of the moderator.
You may preserve formatting (e.g. a code sample) by indenting with four spaces preceding the formatted line(s)